Adding basic time series charts
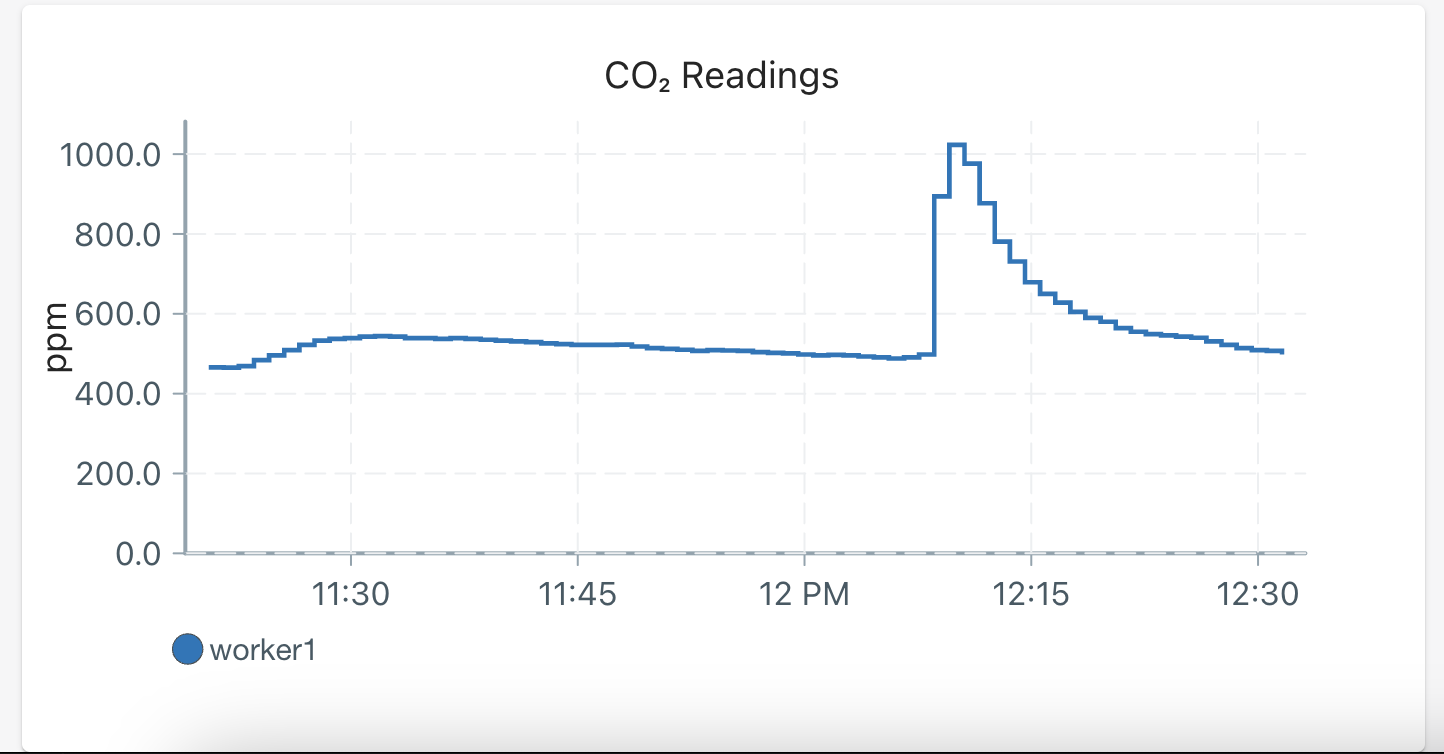
You can add custom charts to the UI. Below is an example of adding a chart that displays historical and real-time CO2 sensor data.

Step 1
Create a yaml file with the following fields, and place it in /home/pioreactor/.pioreactor/plugins/ui/contrib/charts/. (Plugins can put the yaml file under ui/contrib/charts in there project folder - it will be added upon installation.)
chart_key: a unique identifier for the chart being added, string.data_source: the SQL table to read historical data from. The data source must have atimestamp,pioreactor_unit, andexperimentcolumn, along with a numeric column to plot (see below), string.data_source_column: the column indata_sourceto read and display, string.title: title on the chart, stringy_axis_label: the y-axis label, stringfixed_decimals: How many decimals to display, integer.mqtt_topic: a truncated MQTT topic to read live data from - stripped of thepioreactor/<unit>/<experiment>part. Ex:co2_readings/ppmif the entire MQTT topic ispioreactor/<unit>/<experiment>/co2_readings/ppm, string.payload_key: (Optional) If the MQTT topic is json blobs, use thepayload_keyto retrieve the data from the blob, string.interpolation: (Optional) the interpolation to use between points, default isstepAfter, string.y_axis_domain: (Optional) specify a starting y-axis domain. Must be an array, like[0.0, 0.5].y_transformation: (Optional) an inline JS function to transform the y data. Default is the identity function, string.down_sample: (Optional) A boolean to down-sample the data points from the server or not.
See examples of yaml files here and here.
Step 2
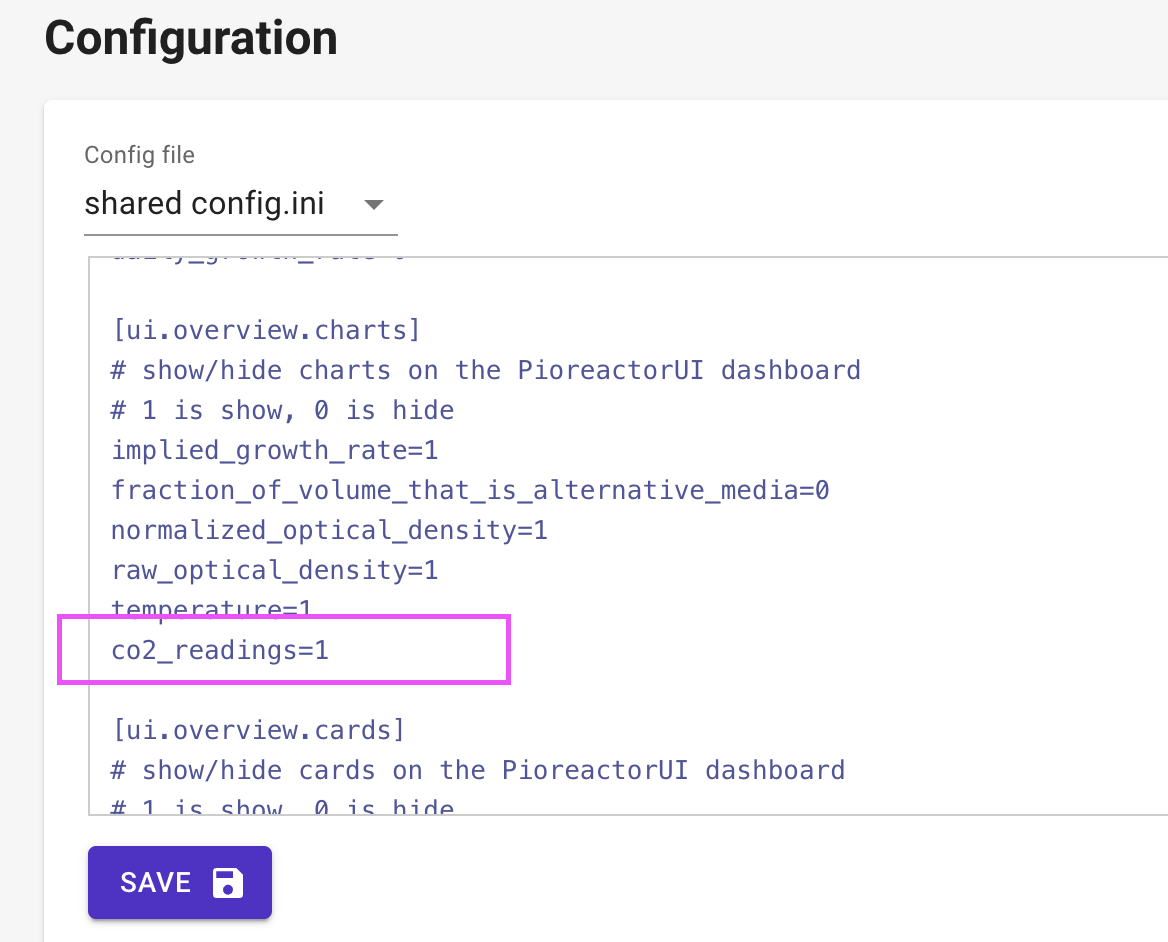
In your config.ini, add your chart key under [ui.overview.charts] and assign it 1. Example:
[ui.overview.charts]
# show/hide charts on the PioreactorUI dashboard
# 1 is show, 0 is hide
...
co2_readings=1
...

Troubleshooting
- If the UI stops displaying data, you may have introduced a yaml file that is not being read correctly. Check out the Pioreactor UI logs by sshing into the leader, and running:
tail /var/log/pioreactor.log
The last few lines should tell you about if a field is missing, a wrong type, etc.
- There is a 30 second cache, so it may take up to 30 second to see new changes in the UI.