Adding your plugins to the web interface
With custom background jobs or automations, the goal is to have it available in the web interface, so you and your users don't need to use the command line at all. We've built support for easily adding to the web interface.
Based on whether your have created a background job, a script, or an automation, adding it to the UI only involves creating a yaml file and placing it in the correct directory.
You should have already added your plugin's Python code to your Pioreactor by some method presented here.
Background jobs and scripts
Adding a custom background job to the list of activities
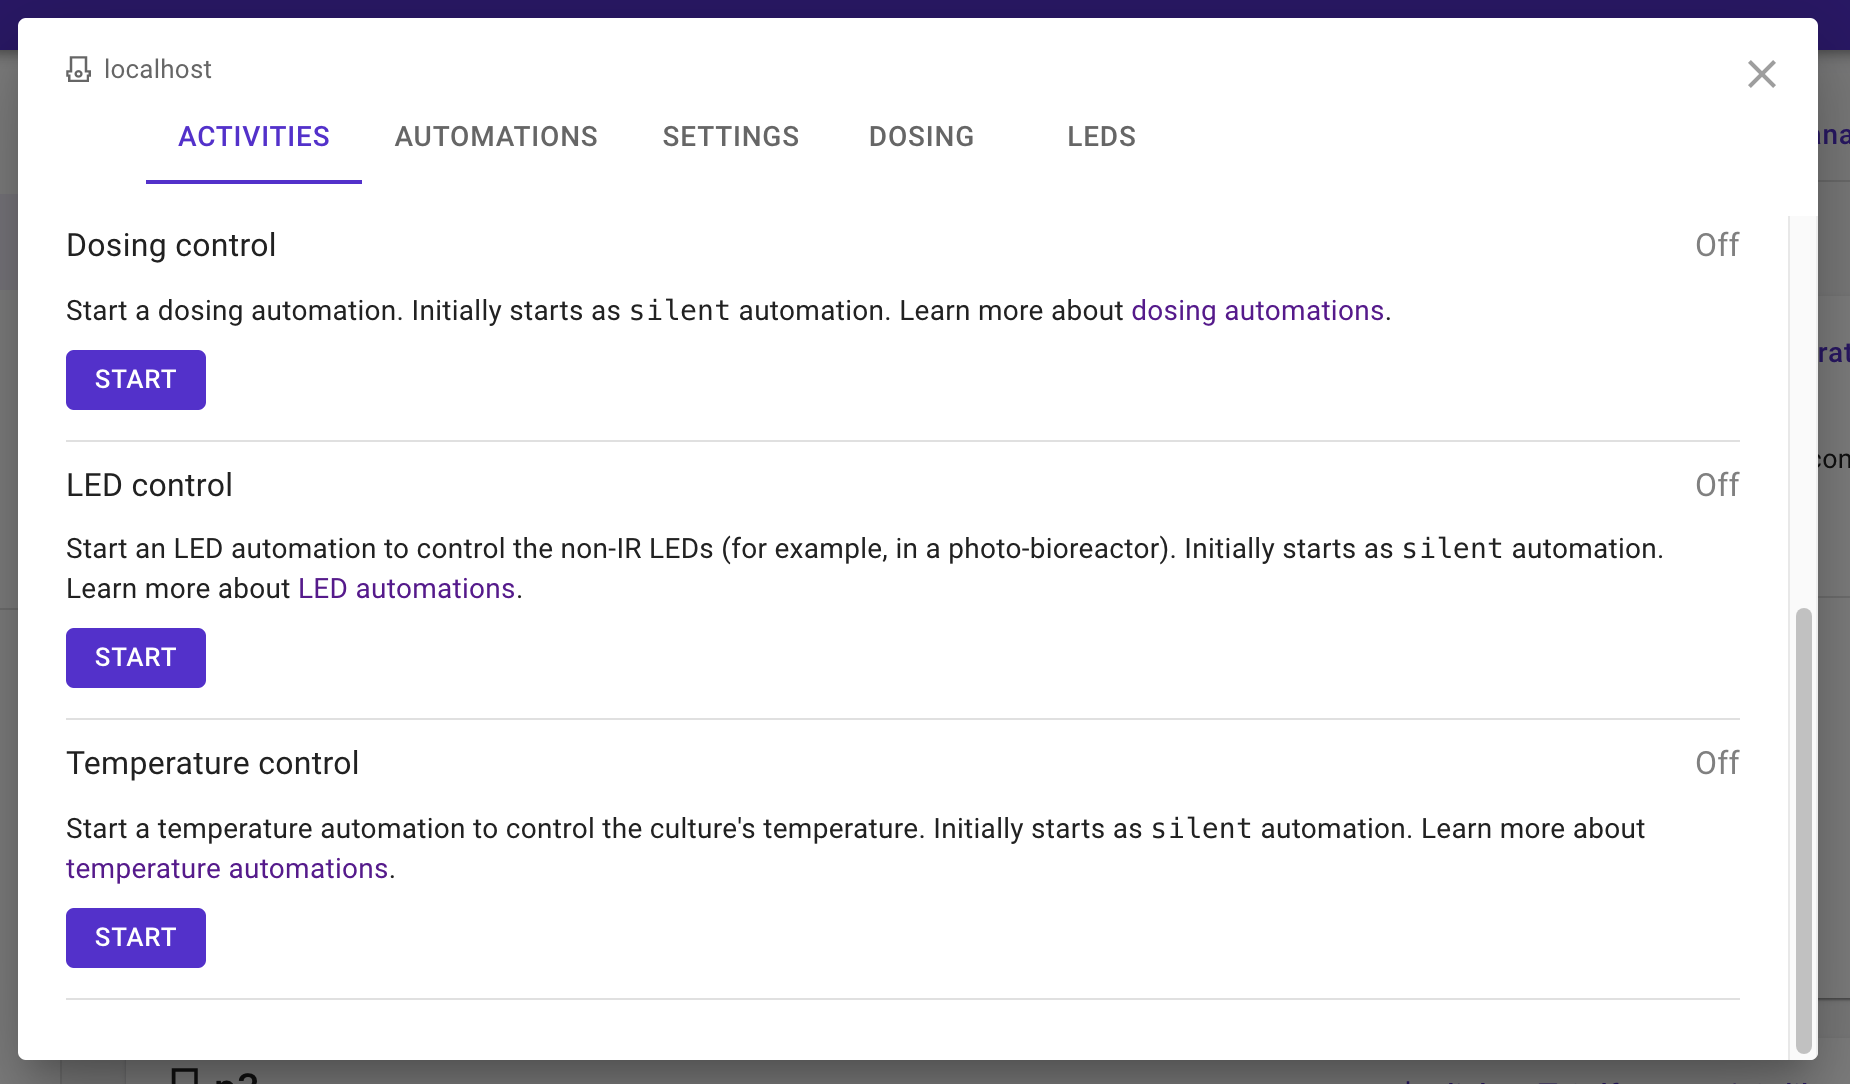
The list of activities, among other things, is sourced from either of two directories:
/var/www/pioreactorui/contrib/jobs/, is the source of the "default" jobs/home/pioreactor/.pioreactor/plugins/ui/contrib/jobs, is a directory to put custom yaml files for jobs.
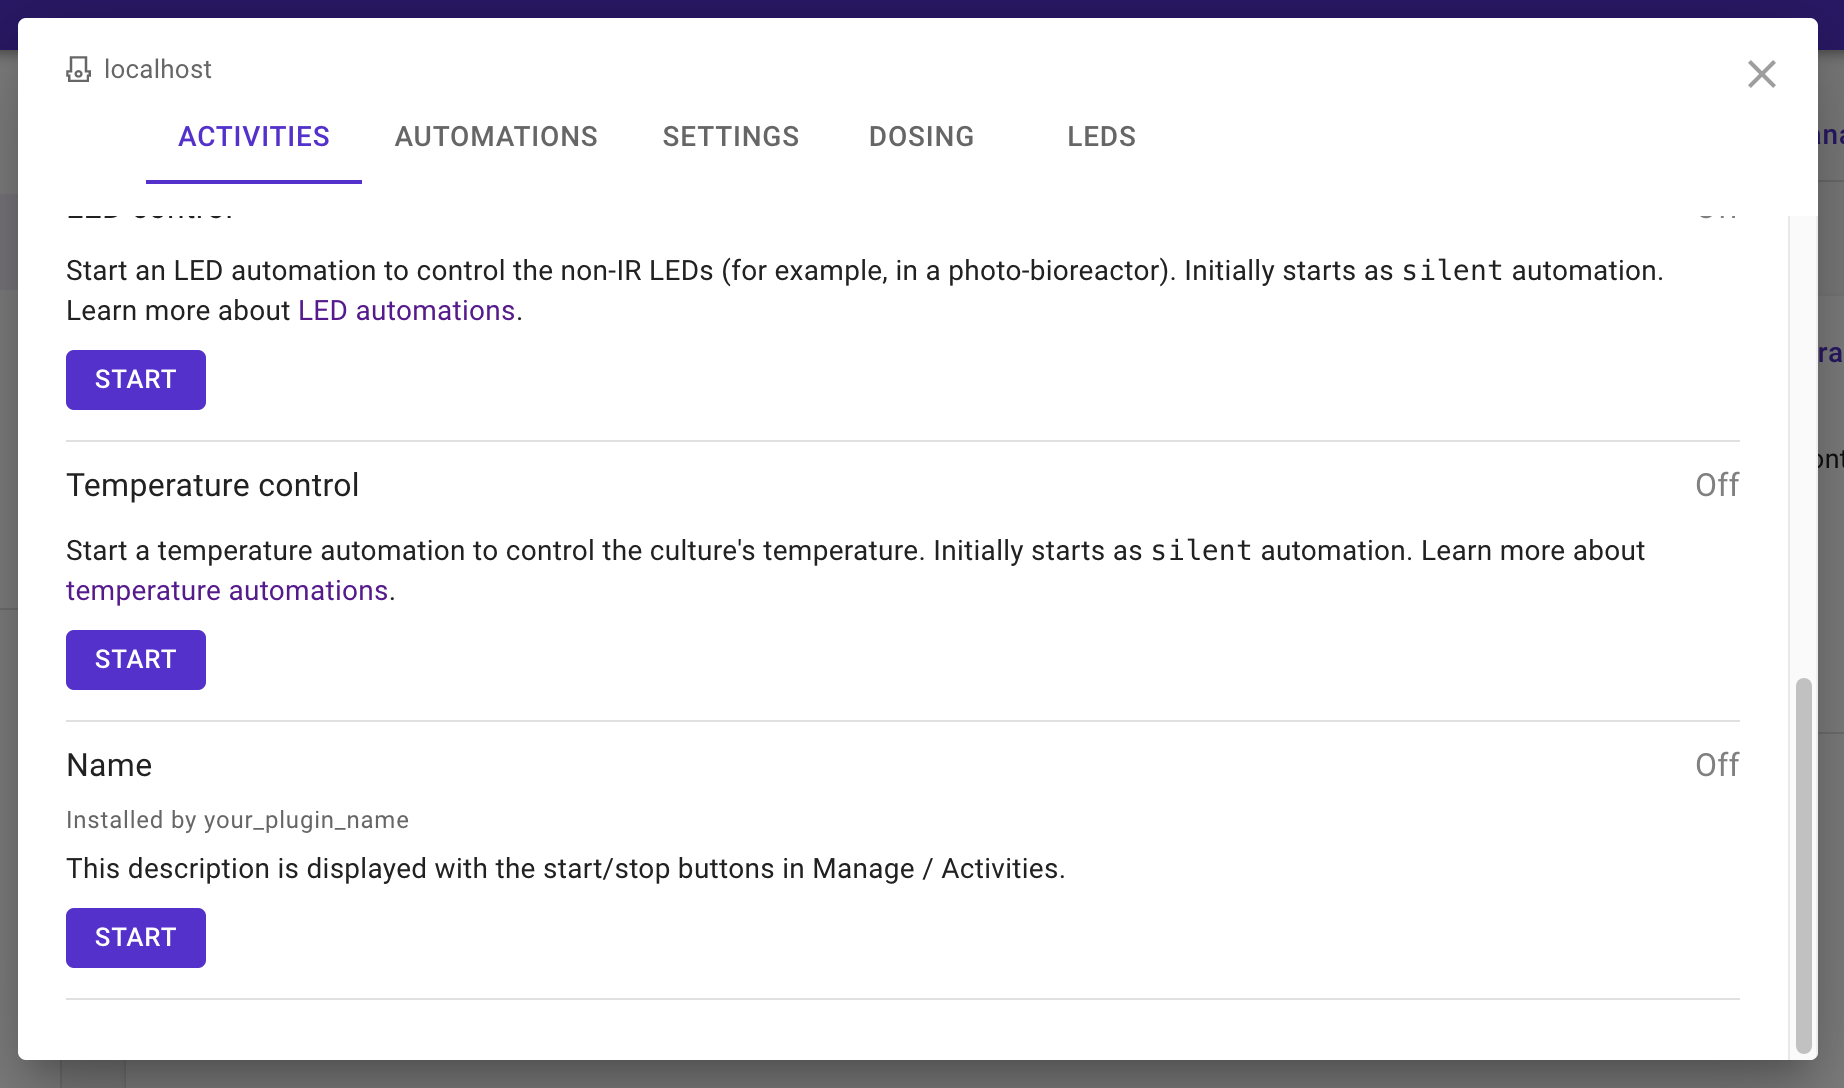
Placing a new yaml file in either of these folders will populate the page with your new job. Here's an example example.yaml file:
---
display_name: Name
job_name: job_name_as_defined_in_Python
display: true  # true to display on the /Pioreactors card
source: your_plugin_name
description: This description is displayed with the start/stop buttons in Control / Activities.
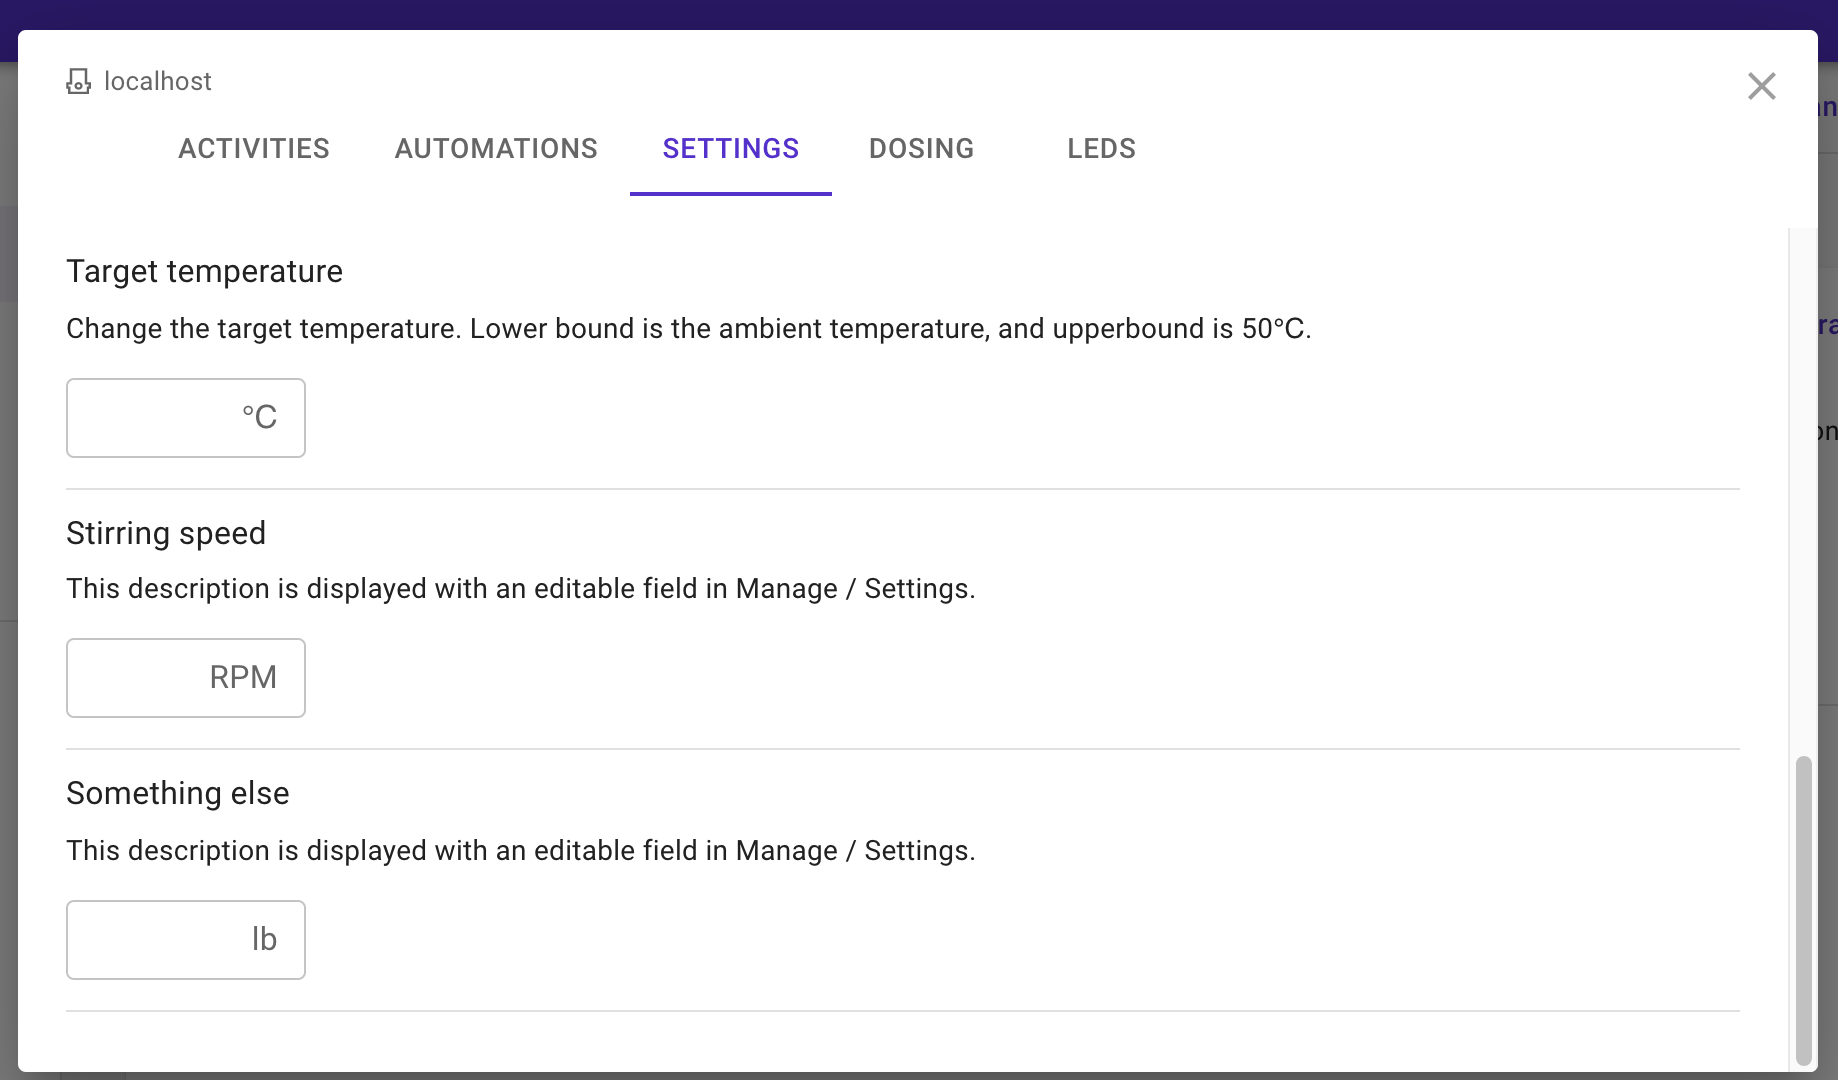
published_settings:
  - key: rpm   # as defined in Python
    unit: RPM  #
    label: Stirring speed # human readable name
    description: This description is displayed with an editable field in Control / Settings.
    type: numeric  # one of numeric, bool, string, json
    default: null
    display: true # true to display on the /Pioreactors card
  - key: something_else
    unit: lb
    label: Something else
    description: This description is displayed with an editable switch in Control / Settings.
    type: bool # one of numeric, bool, string, json
    default: null
    display: true # true to display on the /Pioreactors card
Saving it to either directory above, and refreshing the page:

Adding a custom Python script to the list of activities
Placing a new yaml file in either of the following folders will populate the UI with your new job.
/var/www/pioreactorui/contrib/jobs/, is the source of the "default" jobs/home/pioreactor/.pioreactor/plugins/ui/contrib/jobs/, is a directory to put custom plugins.
---
display_name: Example Script
display: true
job_name: my_script
source: Example Script
description: Run my custom script.
published_settings: []
See more information on the structure of your script here
Automations
Adding a custom automation to the drop-down of automations
Suppose we wish to add our new automation, either installed from a package or via the plugins folder, to the drop-down list of automations users can choose from:
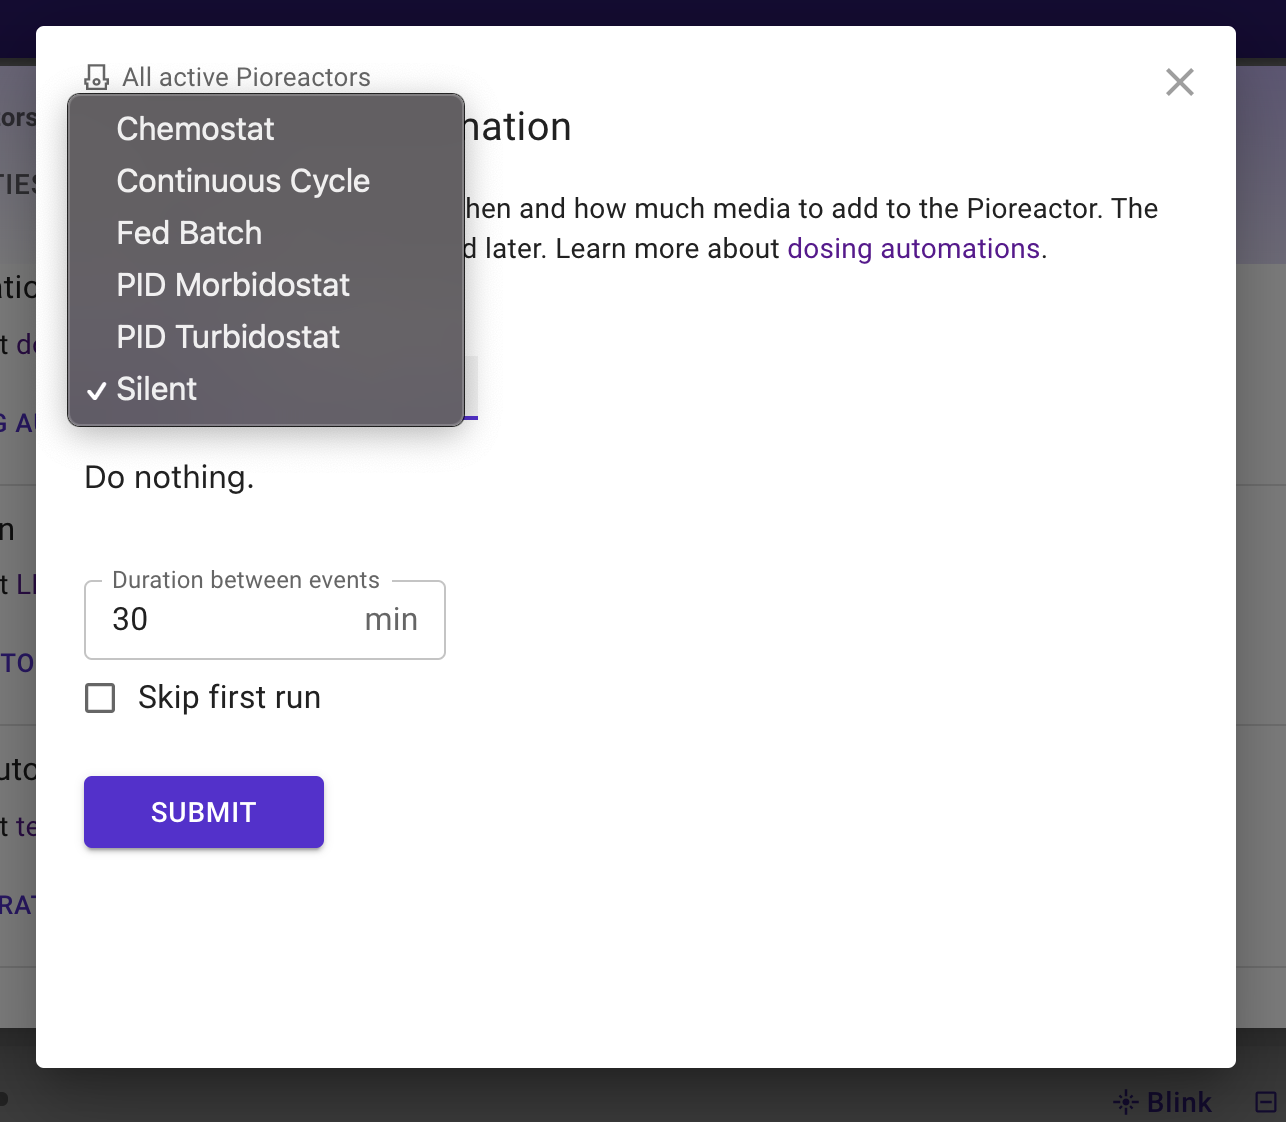
This list is sourced from yaml files located on the leader's Raspberry Pi, in either of two directories:
/var/www/pioreactorui/contrib/automations/, is the source of the our built-in automations/home/pioreactor/.pioreactor/plugins/ui/contrib/automations/{led,dosing,temperature}, is a directory to put yaml files for custom automations.
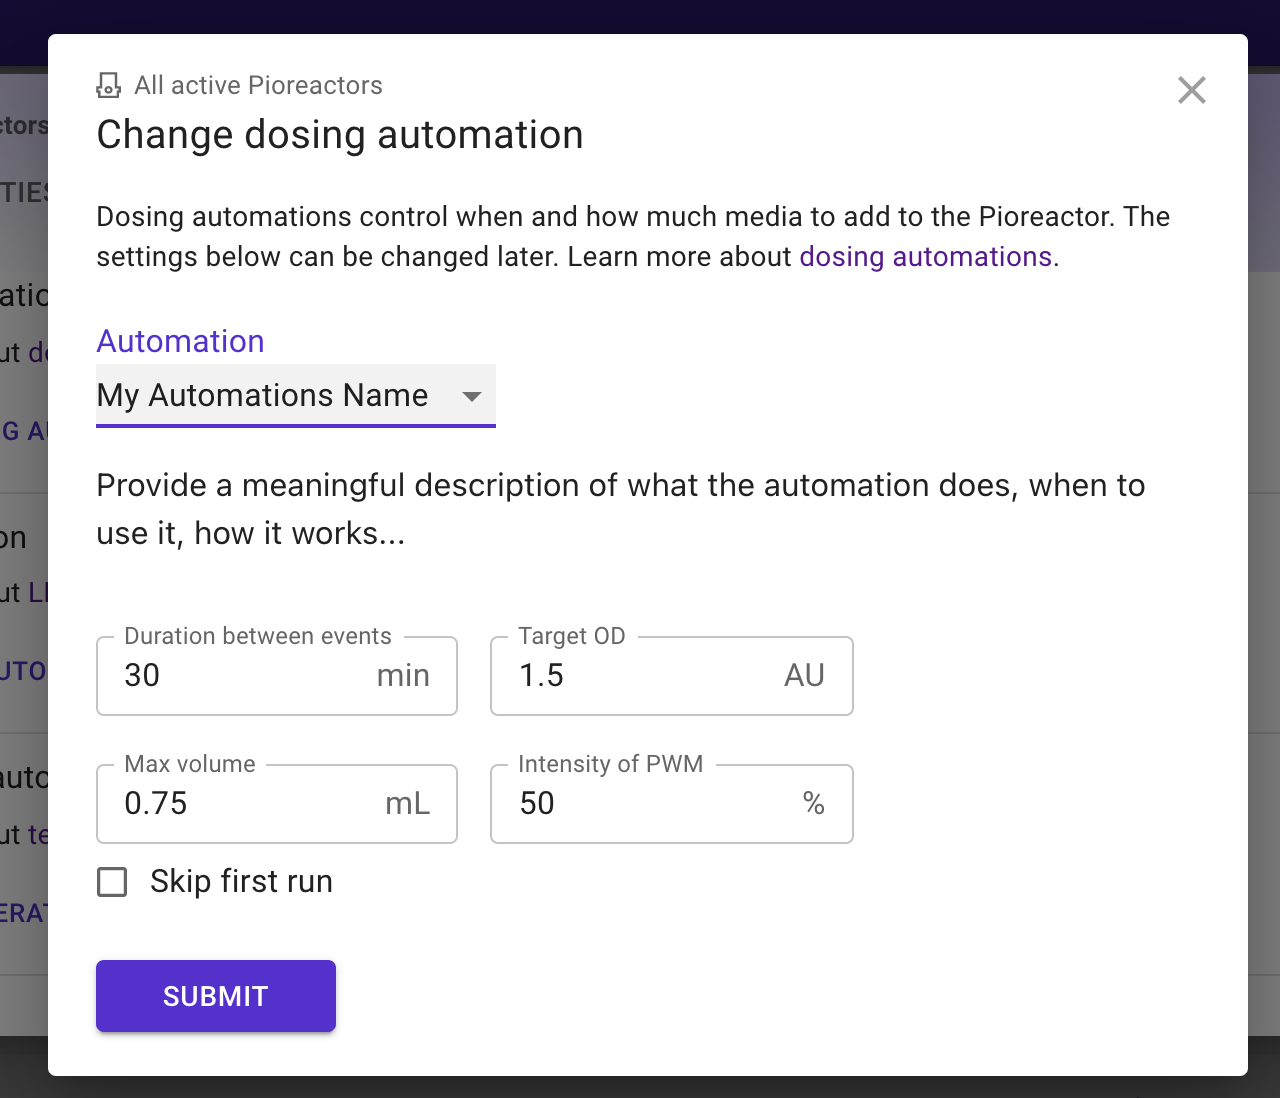
Placing your yaml file in either folder above will populate the dropdown list in the UI with your new automation. Here's an example example.yaml file:
---
display_name: My Automations Name  # human readable name
automation_name: my_automations_name   # the corresponding name of the automation from the Python code.
source: my_plugin_name
description: Provide a meaningful description of what the automation does, when to use it, how it works...
fields:
  - key: duration  # key is the same as the keyword in the Python code.
    default: 30
    unit: min
    label: Duration between events
  - key: target_od
    default: 1.5
    unit: AU
    label: Target OD
  - key: volume
    default: 0.75
    unit: mL
    label: Max volume
  - key: intensity
    default: 50
    unit: "%"  # note: percent signs needs to be quoted.
    label: Intensity of PWM
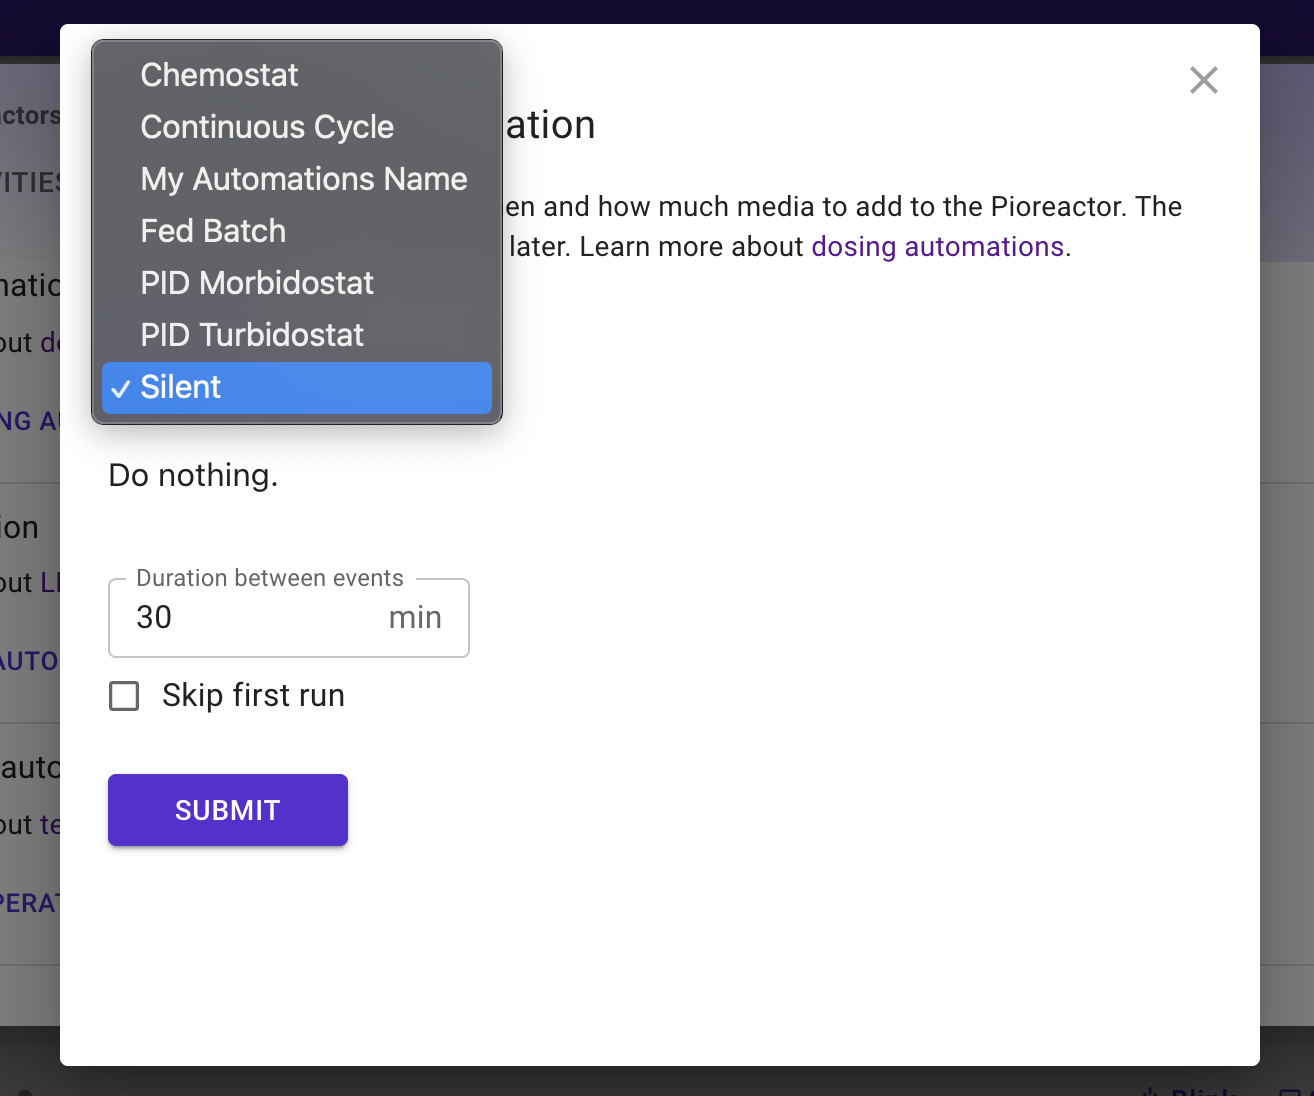
If this file was saved to the folder /home/pioreactor/.pioreactor/plugins/ui/contrib/automations/dosing, we would see the following in the web interface (after refreshing):
More examples of automation yaml files here.
Charts
Adding a chart to display a new data source
If your plugin produces data (or is some novel transformation of existing data), you can also add a new chart to the Overview page. See documentation here.
Troubleshooting
- If the UI isn't display the data from your yaml, you may have introduced a yaml file that is not being read correctly. Look for error logs on the Overview page.
- There is a 30sec cache, so it may take up to 30sec to see new changes in the UI.